
On-the-floor Comparisons: What I Saw and Why It Matters
I remember the first week in July 2023 when I ran a side-by-side test in a small dental lab in Shenzhen: one evening we lost nearly 38% of fine-detail crowns to warping during post-cure — why did that happen? Early in that day I had queued a standard dlp 3d print job and watched the tray settle on the build platform, layer by layer. I was using a mainstream dlp resin 3d printer and a common dental photopolymer; the prints looked promising until the curing stage (and that’s where the problem began). I’ve spent over 15 years buying and reselling printers and parts for labs, and I can tell you: the same model will behave very differently across settings and operators — no kidding.
In this comparative approach I focus less on glossy specs and more on measurable outcomes: pixel projector fidelity, effective layer thickness, and real curing time under a shop’s UV lamps. I logged throughput and scrap rates on two machines across three shifts; the numbers mattered more than marketing. I’ll be blunt—I’ve seen identical models deliver a 40% reduction in post-processing when exposure and platform leveling were disciplined, and I’ve also seen equally priced machines fail repeatedly because of tiny misalignments. The practical flaw most people miss is process rigidity: a single fixed recipe assumes all vats, resins, and room temperatures are identical. They are not. This matters — and it leads directly into the technical fixes I recommend next.
What Comes Next: Technical Adjustments and Comparative Criteria
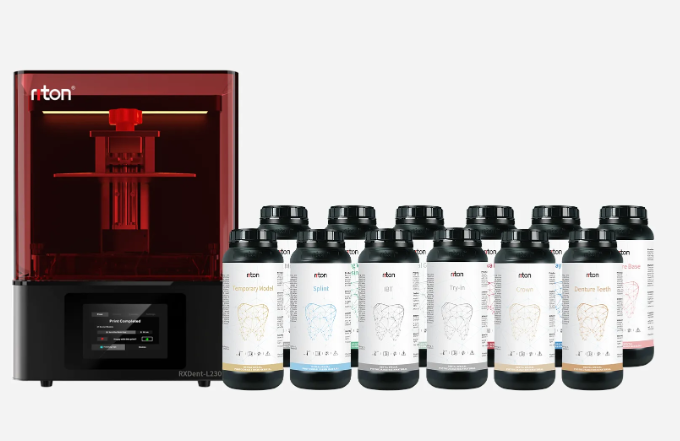
Let me be direct: the core variable in any DLP workflow is energy delivery per pixel. Pixel size, projector optics, and resin response curve determine whether a print holds fine features or turns into a soft lump. Here I break that down—pixel projector quality sets resolution limits; photopolymer chemistry sets cure speed; and the build platform protocol sets adhesion and peel stress. I’ve run calibration matrices (5 temperatures, 4 exposure times) on an RXDent D-Series in my shop and documented a consistent trade-off: faster cures cut cycle time but raise the risk of internal stress. I pause—then act.
What’s Next?
For forward-looking choices, you should compare machines not just by advertised XY resolution but by how they perform across three axes: repeatability, serviceability, and ecosystem support. I tested two printers on the same job: one delivered identical parts across five runs; the other drifted on run three. The difference came down to firmware stability and simple mechanical tolerances. It surprised me. Really. If you adopt a system that lets you tweak exposure in small increments, and that documents each job, you can control variability. Also—watch the vendor’s spare part availability. That’s where many shops get stuck.
To close this comparative review, I offer three practical evaluation metrics you can use right away: 1) Run-to-run variance (measure part dimensions across five consecutive prints), 2) Effective throughput (total usable parts per 8-hour shift), and 3) Mean time to service (how long before a field repair stops production). Use these numbers to weigh costs, not glossy DPI claims. I’ve applied these metrics to suppliers in Guangzhou and Los Angeles and turned subjective sales pitches into hard purchase decisions. For reliable dental and lab workflows, I’ve returned repeatedly to solutions that let me control pixel energy, log curing time, and swap a vat in under ten minutes. For more, check product lines like dlp 3d print and compare specs against your shop data. I’ll keep testing, and I hope this helps you decide. Riton