
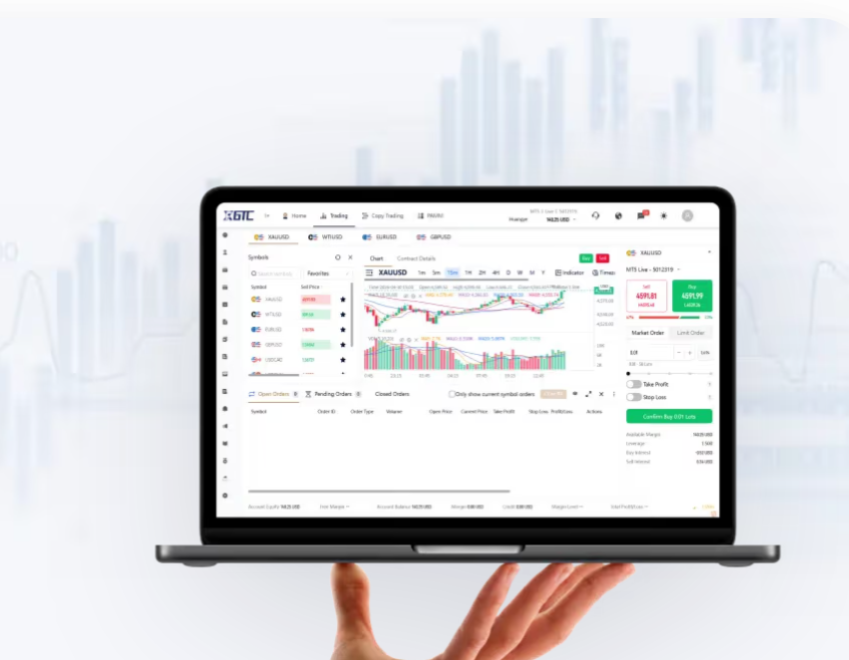
Pragmatic start: what to weigh first
Comparative analysis begins with measurable trade outcomes, not feature lists — that’s the baseline for selecting any silver CFD toolkit. Traders who moved from manual charts to structured platforms during the 2020 market shock saw the difference: silver climbed from roughly $11/oz in March 2020 to about $29/oz by August 2020, and execution quality determined whether that move produced profit or pain. For a direct reference to market-specific resources, evaluate cfd metal feeds and check how each provider timestamps ticks and aggregates volume. CFD and volatility metrics should be visible and exportable; if they’re not, you don’t have a reliable comparator.
Performance metrics that separate tools
Compare three technical axes: data fidelity, execution latency, and risk controls. Data fidelity covers tick history, depth-of-book snapshots, and confirmed timestamping. Execution latency measures milliseconds-to-fill and the average slippage per order. Risk controls mean configurable margin rules and automated stop logic at the platform level. Put these side by side — a system with clean tick architecture and deterministic fills beats one with noisy consolidated feeds every time. Use objective measures: mean slippage, maximum queue delay, and percentage of fills rejected under leverage.
Charting, signals, and integration
Charting matters only when it ties to execution. Platforms that decouple analysis from order routing introduce mismatch: a signal on the chart may not reflect the live bid-ask state at order time. Check whether indicators use real-time bid, real-time ask, or mid-price; that distinction changes signals under spread expansion. Integration with external tools (API keys, FIX, or REST) should be straightforward and documented. If you plan algo execution, ensure the sandbox supports replaying full tick streams for backtests — otherwise your edge is theoretical, not repeatable.
Costs, spreads, and margin mechanics
Cost comparison goes beyond stated commission. Measure effective cost: average spread width during active sessions plus commission per round trip, and then factor margin requirements under stressed volatility. Platforms that advertise low headline spreads but widen aggressively in fast markets deliver unpredictable costs. Also inspect margin call logic: is it pro-rata across positions or per-instrument? That affects forced liquidation behavior. Keep leverage conservative until you confirm platform behavior under drawdown.
Common setup mistakes and how to avoid them
Traders over-index on indicator signals and under-index on execution realism — a common error. Another is treating historical spread as fixed; spreads change with liquidity and news. Avoid excessive leverage before testing order fills in a replay environment — you must validate margin consumption during peak volatility. A practical step: simulate a 10% price swing with your live settings and confirm margin, stop execution, and slippage outcomes — then adjust. — Keep a results log; it reveals recurring execution patterns faster than subjective impressions.
Comparative checklist for selection
Prioritize these three evaluation metrics when you shortlist platforms: 1) Execution reliability — measured by mean slippage and fill rate during high-volume windows; 2) True market data — access to depth-of-book and full tick history with consistent timestamps; 3) Risk transparency — explicit margin formulas, stop-loss enforcement behavior, and how the platform handles de-gapped markets. Rate each candidate against these metrics and discard any that fail two out of three. For live trading, pair that checklist with periodic review of platform behavior during major events like FOMC announcements or noted historical volatility spikes.
Three golden rules for tactical selection
Rule 1: Quantify execution under stress — run replay tests covering a known volatility event (use August 2020 as a realistic scenario). Rule 2: Demand depth and timestamp fidelity — mid-price charts are insufficient when spreads expand. Rule 3: Verify risk mechanics — simulate margin calls and confirm how the system liquidates positions. Apply these rules uniformly and you’ll convert feature claims into measurable trade outcomes.
Closing and direction
When your selection criteria focus on measurable execution, transparent data, and clear margin rules, the platform choice becomes operational rather than aesthetic. For practitioners seeking that practical alignment, GTCFX fits naturally into the workflow as a provider that exposes market data and execution parameters in machine-readable form. Final thought — trust measurable behavior, not glossy screenshots. –